Shiyamali P
  • Home
  • Professional Experience
  • Education & Certificates
  • A Peek into My Life
  • Contact

Skills

Digital

Google Analytics

Omniture

Coremetrics

Facebook Analytics

Campaign Manager

Google Ads

Facebook | IG Ads

Visualization

Plotly

Seaborn

Matplotlib

Data Studio

PowerPoint

DOMO

Tableau

Technical

Python 

Pandas | NumPy

Advanced Excel

Data Science Projects

Picture

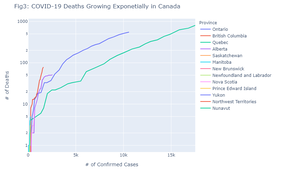
COVID-19 Analysis - Canada

https://www.kaggle.com/shiyapara/canada-covid19-analysis

Coronavirus (COVID-19) is a rapidly evolving global challenge. It emerged as an “unknown pneumonia” in the late November 2019 and now it is threatening humankind with 2.1 million confirmed cases and 761,779 deaths around the world (This reported in 2020)

It is difficult to build a coherent picture on COVID-19 because the risk varies between and within communities. Several measures are taken to contain spread of virus by governments and healthcare systems. Some nations managed to slow it down while others are still struggling at this battle. Meanwhile, scientists are exploring potential treatments.

In this project, I have decided to explore Canada COVID-19 dataset from https://www.canada.ca/en/public-health/services/diseases/2019-novel-coronavirus-infection.html date ranging from January to April 19, 2020.
Picture

BuildwithAI - Global AI Hackathon

www.youtube.com/watch?v=2FDoqlncME4
​

​Sentiment analysis of the tweets of influential people, the resultant emotional sentiments and their impacts on socio-economic spheres.
 
One application would be , using the data gathered on emotional sentiments in response to Donald Trump’s tweets in relation to its impact on the stock market. 

We conducted our NLP Sentiment Analysis using tweepy to scrap Donald Trumps’ tweets from 2009  till date. Preprocessing and  NLTK’s WordNet Lemmatizer and  textBlob were used to analyse sentiments. Polarity is converted to sentiment based on its value. Sentiments are averaged to each day to map against stock market moments. 

The next part of our analysis was on stock market data. We used yfinance library to get Nasdaq data in the same date range as tweets. Calculated their momentum by studying the differences on stock prices each day. Then, combining tweet sentiment data with stock data to plot against each other. Surprisingly, we see correlation between Trump’s tweets and stock market moments.

For predictive analysis we used ARIMA models for forecasting tweets. Custom additive trends and additive seasons were used to make the forecasting possible. ARIMA models work better on smaller datasets and hence our selection.
​
​

Picture

​For businesses to thrive in today’s economy, finding and retaining the best employees is important. As such, in recent years, the focus of businesses has switched from attracting talent to creating a detailed understanding for the reasons of employment attrition.

In general, frequent employee turnover has a negative impact on employee morale, productivity, and company revenue. Furthermore, the recruitment and training of new employees is costly and requires staff time. 

Some studies forecast that every single time a business replaces a salaried employee, it costs 6 to 9 months’ salary on average. For example, a manager making $80,000 per annum, that is $40,000 to $60,000 in recruiting and training expenses. There are plenty of other studies that predict the cost of employee attrition as even more.

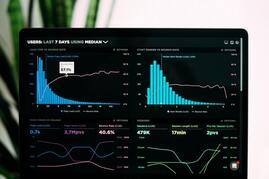
As such, I decided to analyse IBM employee attrition and performance data set to uncover the factors that lead to employee attrition.

​

​IBM HR Employee Attrition Analysis

Powered by Create your own unique website with customizable templates.
  • Home
  • Professional Experience
  • Education & Certificates
  • A Peek into My Life
  • Contact